A lot has happened since our club was founded in 2019, and we’ve been asking ourselves: How much money have we actually contributed to the SYC each year? How has that amount changed over time? And how is the money distributed among the SYC’s individual projects? Our treasurer, Fabian, has taken on exactly these questions. He compiled all the bank transfers from Biyoom to the SYC and also sifted through seven years of expense reports to assign each individual expense to a specific project.
Normally, you only see these figures as a snapshot: Once a year, Fabian reports on the income and expenses of the past club year in the financial report. Now you can see the figures over time …
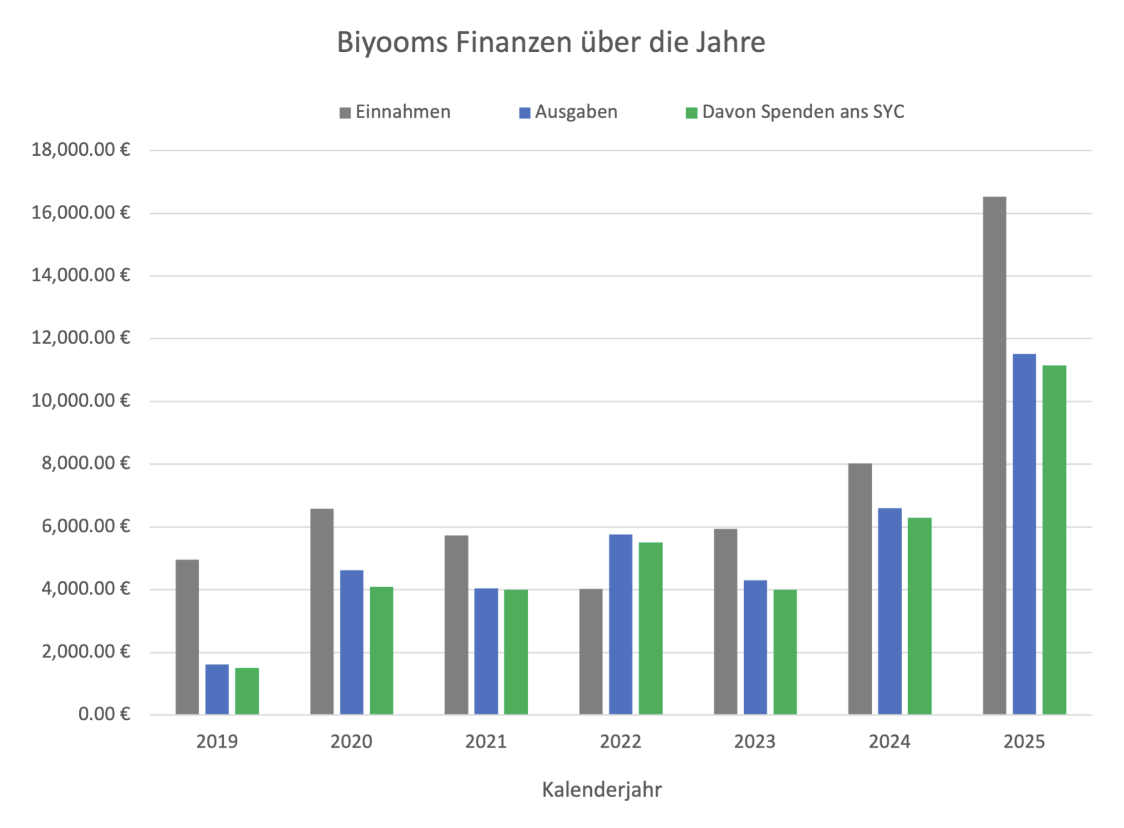
Biyoom's Revenue and Expenses and Donations to SYC for the Period 2019–2025
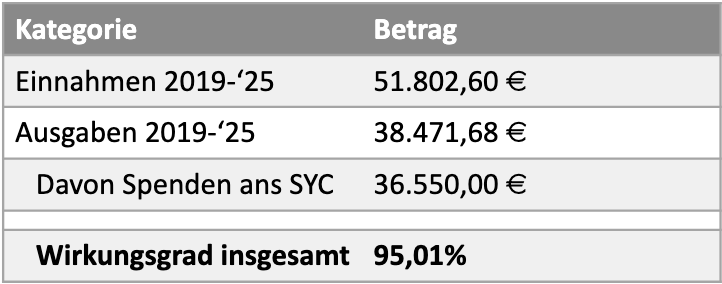
… and, on the other hand, marvel at the total revenue and expenses: we’ve already brought in over 50,000€ and supported the SYC with nearly 37,000€ over the past 6 years.
But what about the SYC’s expenditures? We’ve created an interactive dashboard that shows the trends since 2020 at a glance. You can see how Biyoom’s transfers and the SYC’s actual expenditures have compared over the years, and get a clear picture of how the SYC allocates its budget among individual projects—and how that allocation has shifted.
Just try it out for yourself: Click on the screenshot or follow this link. Currently, the dashboard is only available in German. We apologize for the inconvenience!
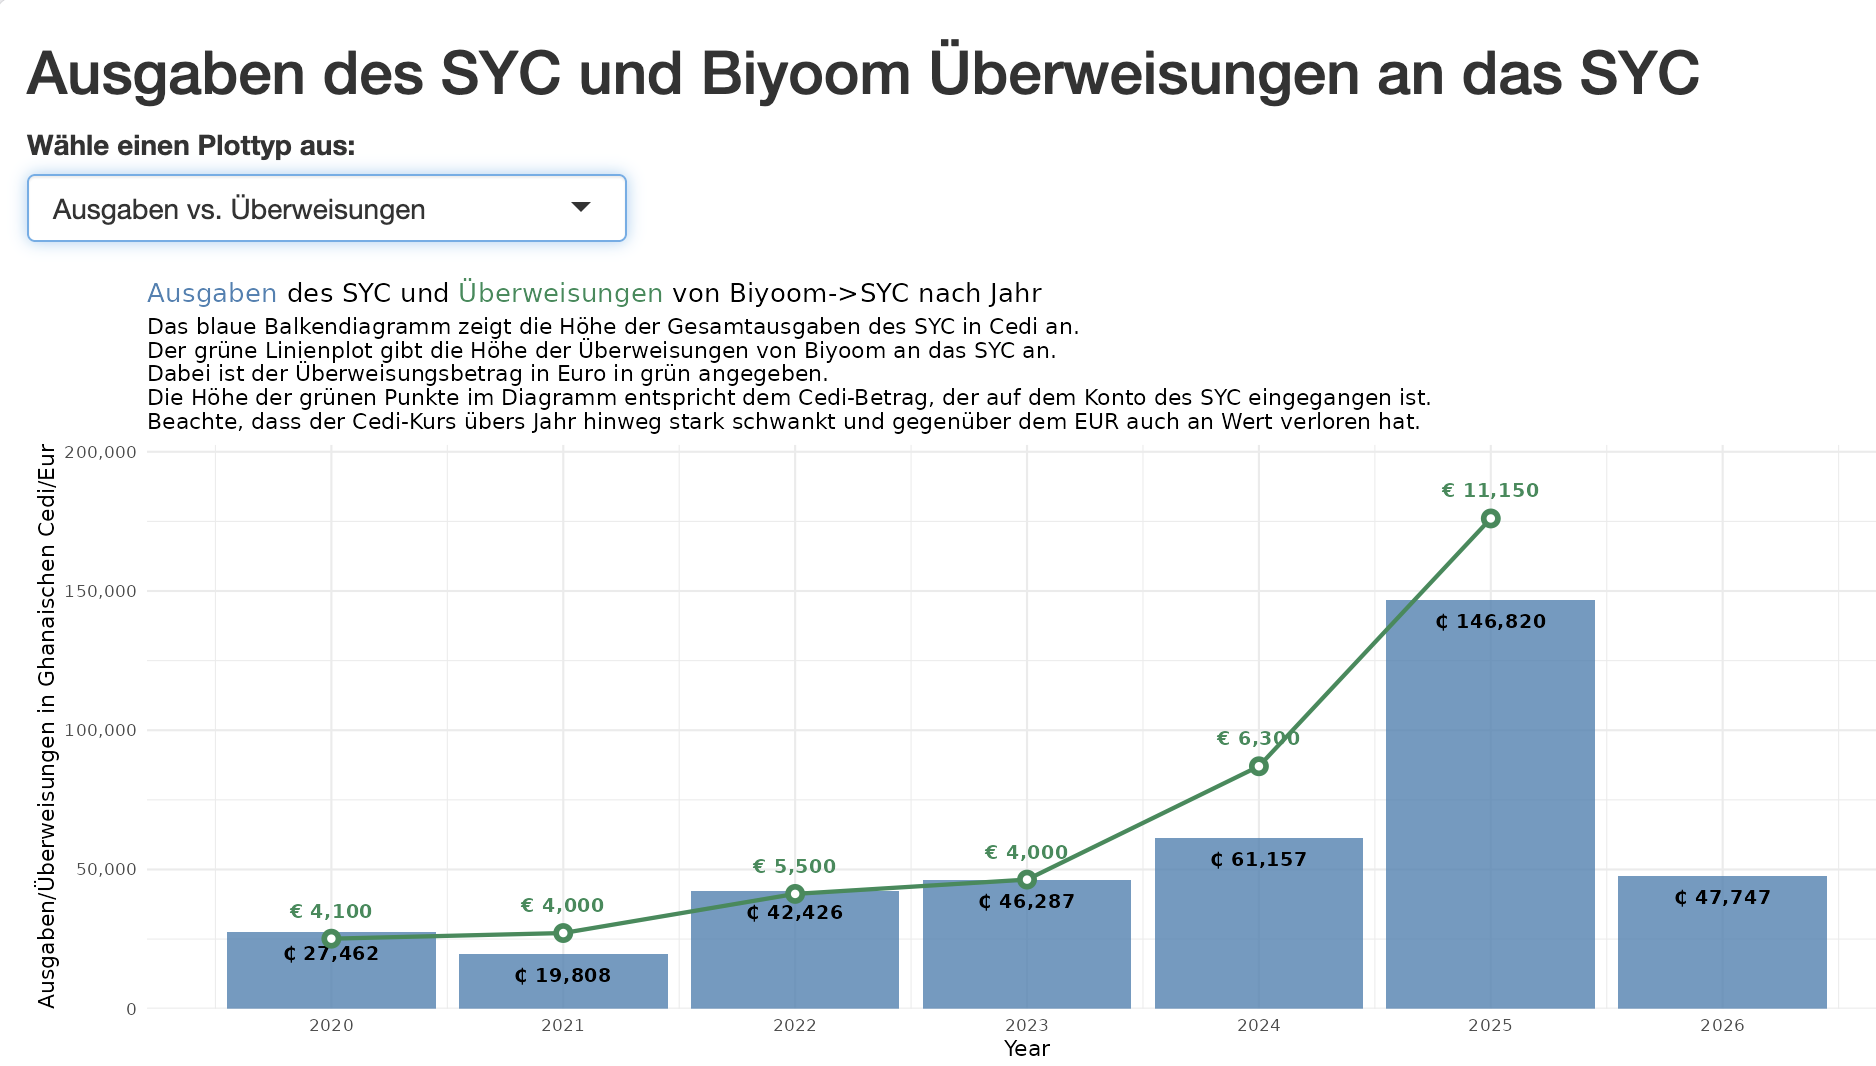
Click on the screenshot to open the interactive dashboard and learn more about the SYC's finances.